The mOS Dashboard is a central hub where you can easily see important information and make informed decisions at a glance. In this help file, we'll take a look at all the different elements available and what they mean.
Accessing the Dashboard
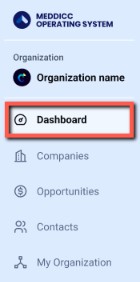
The Dashboard is the first page you will land on whenever you log into the mOS. If you move to another page and would like to access it again, simply click on Dashboard on the left-hand side of the screen.
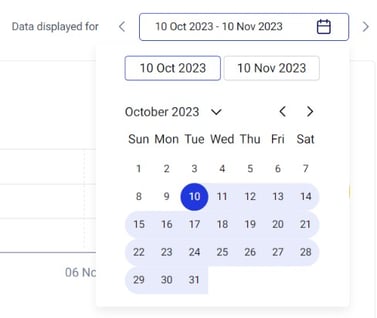
Selecting the correct time frame
Using the date picker in your Dashboard, you can effortlessly choose the specific time frame you want to review data for. Just click on it, select your preferred start and end dates, and the data will be automatically filtered accordingly.
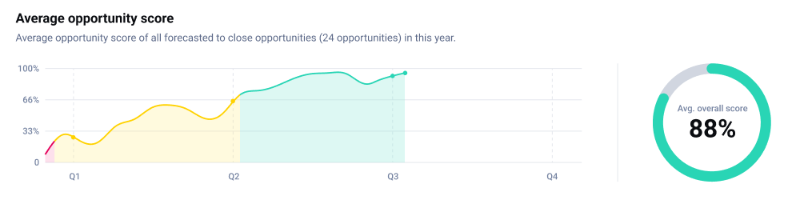
Average Opportunity Score
The AOS helps you assess the overall quality and potential of opportunities within a sales pipeline. It aids in prioritizing efforts by highlighting opportunities with higher scores, indicating a greater likelihood of successful deals. The higher your AOS is, the more likely you are to succeed! Within the Dashboard, your score is viewable on the dated chart or on a pie chart.
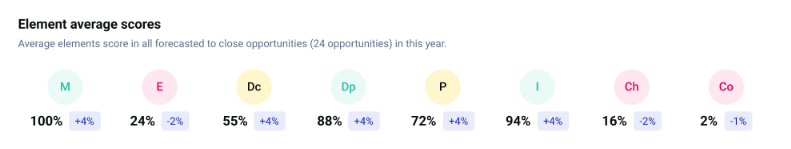
Elements Average Scores
The EAS helps you calculate the average score for each of the elements within the MEDDPICC framework for all the opportunities that are forecasted to close within the current year. It's a way to gauge the overall health and readiness of your sales opportunities, considering how well they align with the MEDDPICC framework's criteria.
In blue, you will also see how these scores evolved in the timeframe selected on the top right-hand side of the screen.